Continuous IV Health Monitoring System
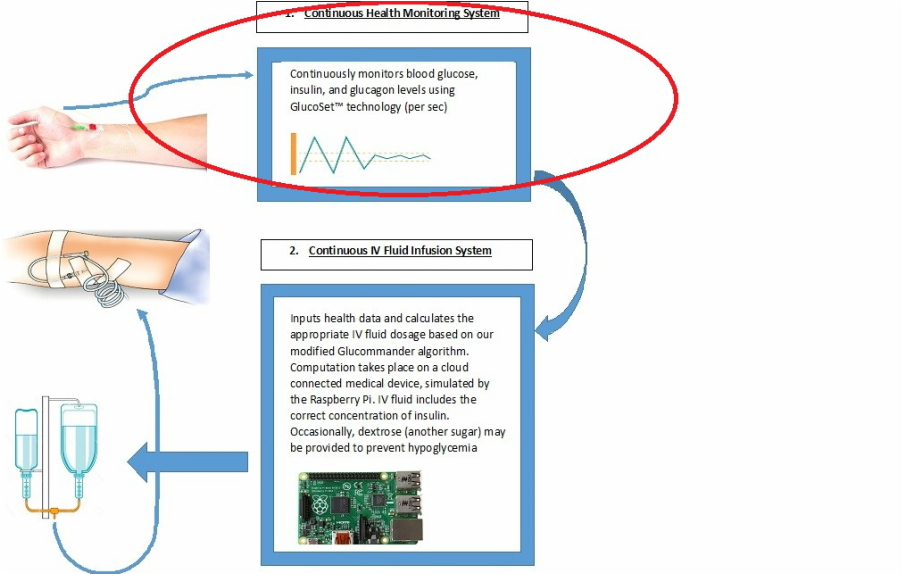
Physical Location: In order for the glucose monitoring to be continuous, we envision a sensor utilizing the technology of Glucoset™. Thus, it will be a thin optical fiber inserted into a patient’s radial artery with a gel tip. Light will travel through the optical fiber toward the gel tip, as that gel tip contracts and expands depending on the concentration of glucose colliding with the gel tip. Based on the input from the light, the Glucoset™ sensor will calculate changes in blood glucose concentrations per second as well as measure the current blood glucose concentration. Both of these data will be fed as inputs into the Continuous IV Fluid Infusion System. In our simulation, the inputting of these values are taking place in the Raspberry Pi, which represents the combined health monitoring and insulin infusion system that is wirelessly connected.
Function: Glucose, Insulin, and Glucagon are three contents crucially necessary for the maintenance of glucose homeostasis, metabolism and the prevention of diabetes. For each of the three, there is a range for optimal concentrations, excessive concentrations, and low concentrations. For example, an excess of glucagon in the absence of insulin and glucose triggers hunger, prompting the patient to request food. Likewise, an abundance of blood glucose triggers a higher concentration of insulin infusion. While the project limits itself to monitoring the fluctuations of the blood, glucose, insulin, and glucagon, the basic premise of our idea can be implemented to track other contents of the patient’s blood, i.e. white blood cell count, or can allow for a non-intravenous health monitoring system.
Code: Since it is unfeasible to measure the glucose of an actual patient or engineer with hardware worth thousands of dollars, we instead researched average daily blood glucose levels over a span of 24 hours. We realized that for most of the non-digestive times, blood glucose hovered around a basal glucose rate, 80 mg/dl, and only actually fluctuated following a meal time. Thus, we created variable glucBase equaling 80, and then created an array for the increase in glucose during digestion called glucAdd. We tracked the rise and fall in the glucose levels in the 2 hours immediately following breakfast, lunch, and dinner, and inputted the rise in the blood glucose values in to the first half of the array. However, rather than hardwiring falling glucose values for the second half of the digestion time, we wanted to simulate how insulin causes blood glucose to decrease. Thus, we left the second half of glucAdd array with repeats of the highest value. The actual glucAdd array is the following:
{3,10,17,24,31,38,45,52,59,66,72,77,80,80,80,80,80,80,80,80,80,80,80,80,80};
Since glucagon is produced in the absence of glucose, the two are inversely related, Thus, we have kept glucagon as 9600/bloodglucose.
Back to introduction
